The Value of Assessing Myocardial Deformation at Recovery after Dobutamine Stress Echocardiography in Predicting Coronary Artery Disease
Author'(s): Abdulaziz aboshahba MD1, Hani Khalaf MD2, Ali Alamin MD2, Sami Nouh MD2 , Abdulaziz Rezq MD2 , Ahmed H Dawood MD3, Ibrahim Altaj4, Gamal Abdelhady MD5, Mohamed Elbordy MD5 , Raphael Solomon MD1, and Abdelmohsen Mostafa MD2*
1Cardiology, PAAMCC, KSA.
2Cardiovascular Department, Faculty of Medicine, AL AzharUniversity, Egypt.
3Cardiovasculrar Department, National Heart Institute, Egypt.
4Cardiology, KSA.
5National Heart Institute, Egypt.
*Correspondence:
Abdulaziz Aboshahba MD, Doctor of medicine in cardiovascular medicine, Cardiology department, ALazhar University, Cairo, Egypt.
Received: 19 October 2020; Accepted: 07 November 2020
Citation: Khalaf H, Alamin A, Nouh S, et al. The Value of Assessing Myocardial Deformation at Recovery after Dobutamine Stress Echocardiography in Predicting Coronary Artery Disease. Cardiol Vasc Res. 2020; 4(5): 1-9.
Abstract
Background: The assessment of left ventricular (LV) longitudinal strain and strain rate using two-dimensional speckletracking echocardiography increases the sensitivity for detecting myocardial ischemia compared to the visual assessment with RWMA so increase the detection of coronary artery disease.
Aim of the work: The aim of this study was to evaluate the diagnostic value of left ventricular global longitudinal strain and strain rate during the recovery stage after dobutamine stress echocardiography (DSE) for detection of significant coronary artery disease (CAD).
Patients and Methods: The study conducted on 43 patients (27 males and 16 females) with suspected CAD. All patients underwent dobutamine echo. Offline STE and coronary angiography. We excluded all patients with RWMA at rest. The data was analyzed using MedCalc software using ROC curve and Correlations methods.
Results: There was significant reduction in global longitudinal strains at recovery in the patients with significant CAD in comparison to patients with normal coronary angiography (P value <0.0001) with a sensitivity and a specificity of 91.7% and 88.9% respectively. Systolic strain rate (SSR) was increased in CAD (-) group from rest to low dose and at recovery stages, mean were (-1.9, 2.4 and 2.4) respectively while blunted from rest to low dose and during recovery in CAD (+) group, mean were (-2, -2.1 and -1.4) respectively. The optimal cutoff value of SSR at recovery for detection of CAD was -2.05 (sensitivity 96%, specificity 88.6). The territorial longitudinal strains at LAD, LCX and RCA territories did not differ significantly in patients with CAD whatever the coronary lesion.
Conclusion: The measurement longitudinal strain and strain rate using STE at recovery stage after dobutamine echo is sensitive and accurate tool in the identification of CAD and nearly equal to expel1 wall motion analysis. This supports its use as screening test to identify and risk-stratify CAD.
Keywords
Introduction
Patients with suspected coronary artery disease (CAD) are a heterogeneous group with multiple risk factors and variant complaints. As long as these patients do not present a typical change in electrocardiography (ECG) or resting conventional echocardiography, it may be complex to diagnose those patients. The identification of patients at high risk for CAD using conventional assessment of clinical symptoms, electrocardiogram (ECG), and resting echo is frequently challenging.
Thus, diagnostic tools to rule out a relevant coronary artery disease (CAD) are desirable also with respect to increasing healthcare costs.
The misdiagnosis or over diagnosis of patients with chest pain can be associated with serious clinical events or a waste of medical resources, respectively [1].
Dobutamine stress echocardiography (DSE) is a well-established method for detecting myocardial ischemia. The classic echocardiographic findings of ischemia are new or worsening abnormalities of radial wall thickening [2]. However, interpretation of these findings is subjective and dependent on experience [3]. Although speckle tracking strain imaging (STI) has been introduced as a novel method to overcome these limitations [4].
Combination of speckle tracking to dobutamine echocardiography can provide more accurate information in the prediction of CAD.
In fact, the technical problem may be particularly questioned at peak-dose dobutamine.
Myocardial stunning occurs after dobutamine or exercise induced ischemia [5]. Due to the ischemic cascade, persistent wall motion abnormalities (WMA) after ischemic insults are observed for duration beyond the resolution of chest pain or electrocardiographic change [6].
However, little is known about whether persistence of induced ischemia during the recovery period after DSE helps in the detection of significant coronary artery disease (CAD).
Aim of the study
The aim of this study was to evaluate whether performing an assessment of myocardial deformation using STE during the recovery stage after dobutamine stress echocardiography (DSE) allows detection of significant coronary artery disease (CAD) in patients with chest discomfort.
Patients and Methods
This is a prospective observational study that included 52 patients with suspected CAD who were referred to the Department of Al-Hussein University hospital from March, 2015 to September, 2017 for assessment of CAD by DSE. We excluded 6 patients whose echo-cardio graphic images were unsuitable for strain measurement and 3 patients with impaired systolic function EF less than 50%.
The study comprised 43 patients (27 males (63%) and 16 females (37%).
According to the coronary angiography findings the studied population was classified into two groups:
Group (1) included 18 patients with normal coronary angiography or non-significant coronary artery disease {7males and 11 females with mean age 55.32 ± 5.9 years}.
Group (2) included 25 patients with significant coronary artery disease {20 males and 5 females with mean age 55.46 ± 7.92 years}.
Patients were selected according to the following criteria: Inclusion Criteria:
Any patient presented with suspicion of CAD (low, intermediate and high pretest probability).
Exclusion Criteria
History of confirmed CAD (Percutaneous Coronary intervention, Coronary artery bypass graft or history of myocardial infarction), regional wall motion abnormalities suggestive of CAD by resting two-dimensional Echocardiography, moderate or severe valvular heart disease, atrial fibrillation. Congestive heart failure, cardiomyopathy, congenital heart disease and poor Echo window.
Methods
All studied population was subjected to the following:
Informed consent.
Clinical Examination and History Taking for assessment of Resting 12 lead Electrocardiography (ECG): ECG recorded for analysis of rate, rhythm, BBB and chamber enlargement and ECG criteria of ischemic heart disease. [7]
- Chest pain and its characters including the pretest
- A detailed medical history was obtained from all patients the presence of drug therapy and any of the conventional coronary artery disease risk factors was recorded: age, diabetes mellitus, hypertension, hypercholesterolemia, hypertension and smoking.
Echocardiographic examination
- Conventional 2D Transthoracic Echocardiography: All the patients were examined in the left lateral decubitus position. Standard 2D TTE examination were performed with a "Philips iE33 X Matrix" ultrasound machine using "S5-1" & "X5-1" matrix array transducers (Philips Medical Systems, Andover, USA) equipped with STE technology, using a multi frequency (1-5 MHz). ECG-gated examination mostly used to help us during image acquisition & later analysis.
First, default machine settings (focus, zoom, frame rate, gain, compression etc.) were adjusted in order to improve the image quality, if needed. Then, the following data were obtained:
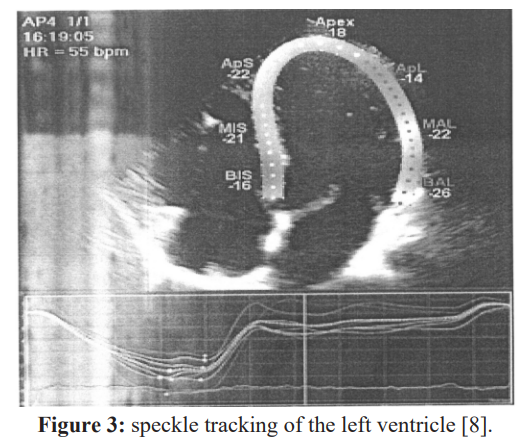
M-mode modality was taken from parasternal long axis view to measure linear internal dimension of LV (left ventricular end diastolic and end systolic diameters). It is carefully obtained perpendicular to the left ventricular long axis, and measured at the level of the mitral valve leaflet tips [8].
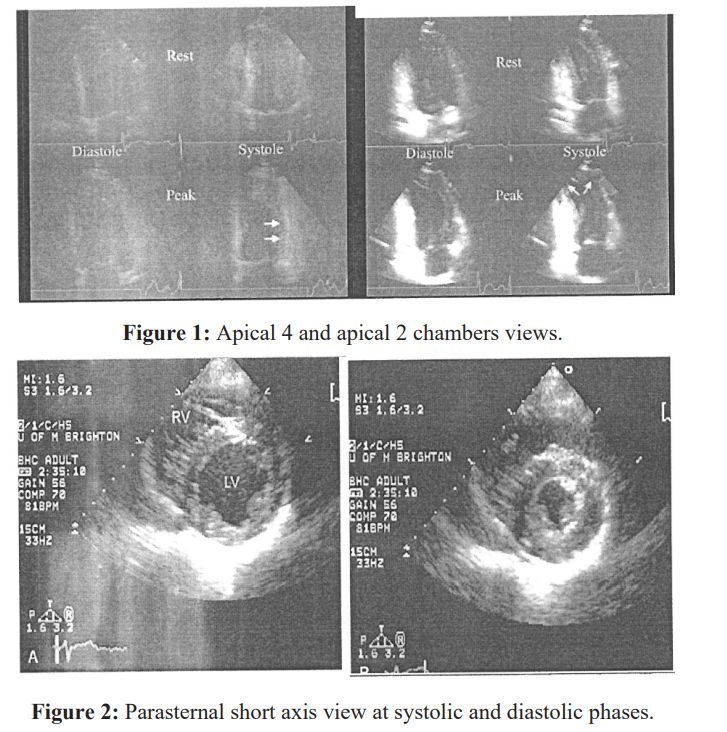
Ejection fraction (EF) was calculated from estimation of end diastolic volume (EDV) and end systolic volume (ESV) from apical 2 and apical 4 chambers views using the following formula: EF = (EDV-ESV)/EDV (Modified Simpson's method) [8].
Dobutamine Stress Echocardiography
Dobutamine was infused through an antecubital vein according to 3-minute stages protocol started by 10 µg/kg per minute, increased by 10 ug/kg per minute every next stages to a maximum of 40 µg/ kg per minute.
In patients not achieving 85% of age-predicted maximal heart rate after 3minutes of 40 µg/kg infusion, atropine 0.2 mg every 1 minute (up to 2 mg) was given. Patients were continuously monitored by ECG, and single recording was obtained at the end of each stage.
Also, blood pressure was followed at rest and every stress stages to assess BP response to dobutamine and to calculate rat pressure product.
Endpoints of Dobutamine Test
- Severe chest pain or intolerable side
- ST-segment depression >2
- ST-segment elevation > 1 mm in leads without a q
- Significant ventricular or supraventricular
- Blood pressure > 240/120 mm
- Systolic blood pressure drop > 40 mm
- Target heart rate achievement (85% of the maximal heart rate predicted for age)
- Achievement of maximum dose dobutamine and
- Large area of regional wall motion (In echocardiography) [9].
Propranolol (1 to 5mg) was used intravenously to reverse the effects of dobutamine if they did not revert quickly.
Image Acquisition
- Two dimensional Echocardiographic Images were acquired from the standard views (parasternal long-axis, parasternal short axis at papillary muscle level, apical 4-chamber, apical 3-chamber and apical.
- chamber). Images were recorded digitally at rest, low dose, peak and recovery.
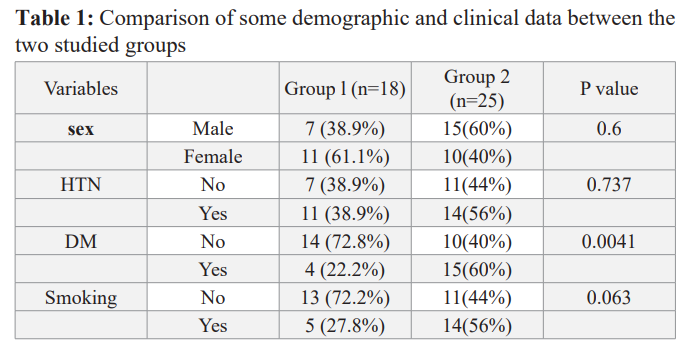
2-D Speckle tracking echocardiographv study
- All studies were performed with an iE33 ultrasound machine (Philips Medical Systems, SA) equipped with the 5 MHz S5-1 transducer.
- Two-dimensional gray scale images were obtained at a frame rate of 70-80 Hz in order to be optimal for speckle tracking, during three cardiac cycles and were then digitally stored for off-line analysis. Quantitative measurements of longitudinal strain and strain rate were made using the QLAB 9.0 software package.
- The following views were taken for later analysis; apical 4 chamber view, apical 2 chamber view and apical long axis view at rest, low and peak dobutamine infusion and at recovery.
- Tracking quality will be visually checked, corrected when needed, and accepted by the operator. Mean global longitudinal Strain and strain rate values of LV will be assessed automatically.
- Automated delineation of endocardial borders was obtained through marking the endocardial and epicardial borders. The area of interest was manually adjusted if automated delineation was not optimal. Segments with poor image acquisition or artifacts were excluded [8].
- Segmental strain of the LV was calculated according to the territorial blood supply as we included all anterior, anteroseptal, apicoanterior, apicolateral, apicoseptal and apicoinferior and mid inferoseptal walls (segments 1,2,7,8,9,13,14,15,16) to the LAD territories, also we included the anterolateral and inferolateral segments (5,6, 11,12) to LCX territories, then we included the basal inferoseptal and mid, basal inferior walls (3,4,10) to RCA territories so the LAD supplies 9 segments, RCA supplies 3 segments and LCX supplies 4 segments, and the sum of segments included to each patient were 16 segment with the exclusion of the segment number 17 [8].
- We summed the strain or the segments belonging to each territory and divided the value by the number of segments to get the mean of strain in each territory [4].
- Peak systole was defined as aortic valve closure in the apical long-axis view by continuous Doppler wave recording. Automated delineation of endocardial borders was obtained through marking the mitral annulus level and at the apex on each digital loop. (Lang et aI. 2015).
Interpretation of the dobutamine Stress Echocardiography
By using the analysis is software; images were compared side by side in quad-screen format by 2 independent observers without the knowledge of the patients clinical, scintigraphic, or angiographic data.
The left ventricular wall was divided into 16 segments which was recommended by American Society of Echocardiography as in Figure 6 and scored by 4-point scale in which Indicated normal, 2hypokinesia, 3akinesia, and 4dyskinesia.
Hypokinesia was considered when systolic myocardial thickening < 5 mm for a segment, akinesia when no systolic myocardial thickening, and dyskinesia when systolic thinning or paradoxical motion away from the left ventricular cavity.
Wall motion score index (WMST) was derived by dividing the sum of individual scores for the 16 segments by 16.
Worsening of regional a synergy or development of new wall motion a synergy at least 2 contiguous segments denotes a positive test result.
Affection of multi-vessel disease was defined as resting or induced wall motion abnormalities in at least two vascular territories in non-overlap segments (apico-lateral and apico-inferior segments).
Negative result was defined by a uniform wall motion and thickening of all myocardial segments (or the absence of wall- motion asynergy other than that encountered during the baseline study).
Coronary angiography
Coronary angiography was performed by using standard (Judkins) technique, using digital imaging acquisition and storage for all patients.
Cine loops in multiple angles were stored, and all analyses were performed in retrospect by a single experienced invasive cardiologist, blinded to the results of the echocardiographic analyses [10].
The data were expressed as a presence or absence of stenosis of left circumflex artery (LCX), left anterior descending (LAD) or right coronary arteries (RCA). Obstruction more than 70% was considered to be significant stenosis. It should be noted that the study protocol did not include routine revascularization and was just performed on clinical indications [11].
Statistical Analysis
The data from angiography and STE were documented. The ability of STE to detect the presence of ischemia and the involved territory was assessed by comparing the results to angiographic findings (the gold standard).
The data were collected & coded using Microsoft Office Excel Worksheet while statistical analysis revised, organized, tabulated and statistically analyzed using MedCalc version 17.7.2 for windows. Data were presented as the mean ± Standard Deviation (SD), frequency, and percentage. Categorical variables were compared using the Chi-square (X2) and Fisher's exact tests (if required). Continuous variables were compared by the Student t test (two-tailed) and one - way ANOYA test for parametric data with Bonferroni post hoc test to detect differences between subgroups.
Correlations between continuous variables are presented as Pearson correlation coefficient (r =0.4-0.6) is a reasonable correlation, (r =0.6-0.8) is a high correlation, (r = 0.8-1.0) a very high correlation.
P value < 0.05 is considered statistically significant; P < 0.0 1 is considered highly statistically significant result.
Result
Patients with symptoms suggestive of CAD (n=52) referred to the Department of AI-Hussein University hospital were screened for study enrollment prospectively, We exclude 6 patients with sub- optimal echocardiographic views and 3 patients with impaired systolic function EF less than 50%.
This study was a prospective study in which the remaining 43 patients were classified according to coronary angiography results into two groups:
Group (1): included 18 patients with normal coronary angiography which represent 26% of studied patients, Mean ± SD of their age was 55.32 ± 5.9 years; there were 7 males (69.2%), and II females (30.8 %).
Group (2): included 37 patients with significant coronary artery disease which represent 74% of the studied patients, Mean ± SD of their age was 56.91 ± 7.63 years, there were 23 males (62.1 %), and 14 females (37.9%).
There was no statistically significant difference between the two groups as regard age, gender, smoking, HTN and DM (Table 1)
HTN (hypertension), DM (Diabetes Mellitus).
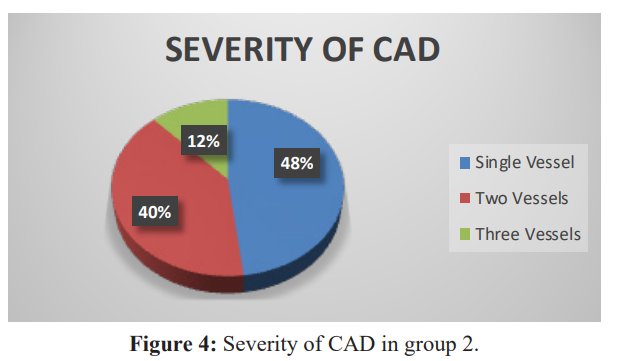
In this study we found 12 patients (48%) with single vessel disease, 10 patients (40%) with two vessels disease and 3 patients (12%) with three vessels disease (Figure 4).
In group 2 we found 14 patients with LAD lesion, 13 patients with LCX lesion and 15 patients with RCA lesion.
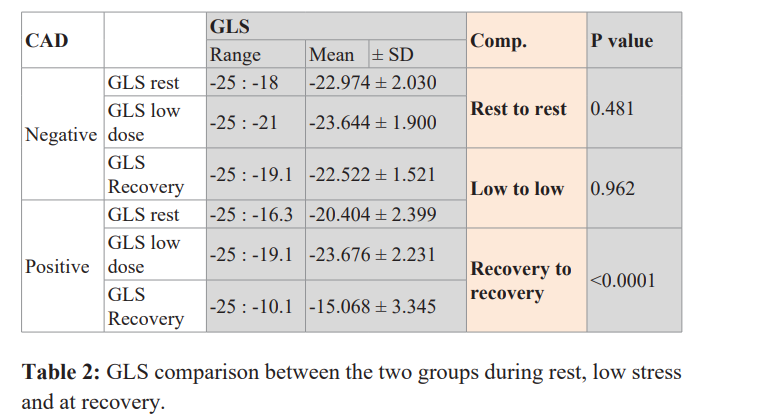
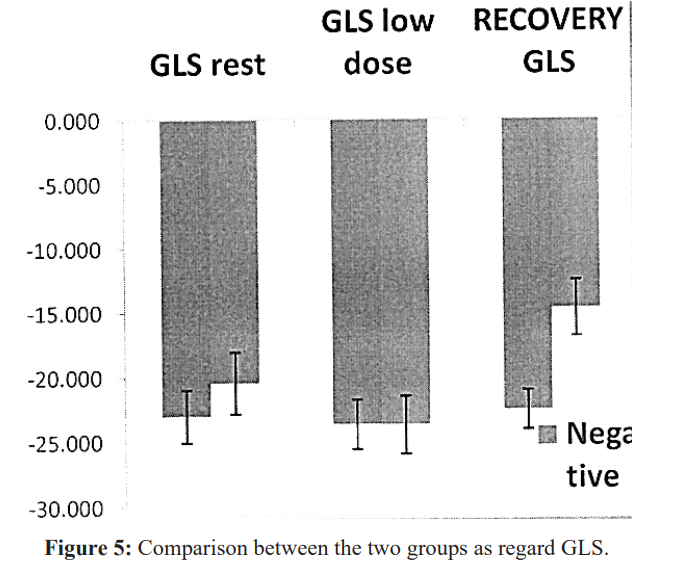
We found that there was no statistically significant difference between the two groups as regard GLS at rest and low stress, the mean ± SD were and P values were (P value =0.0481&0.962) respectively.
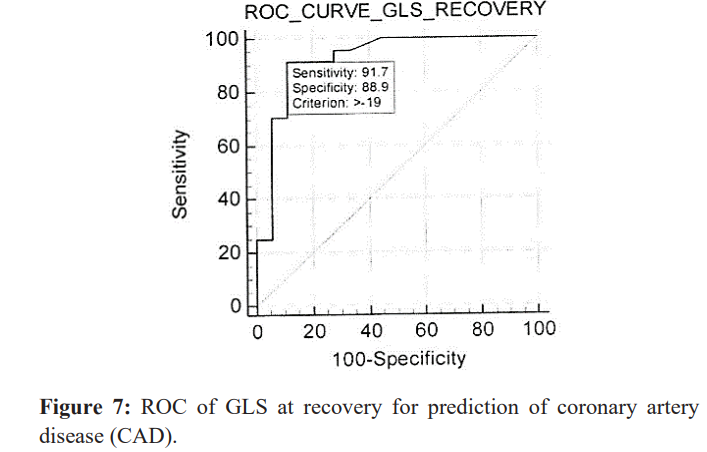
But There was statistically significant difference between the two groups as regard GLS at recovery (P value <0.0001) (Table 2) (Figure 5).
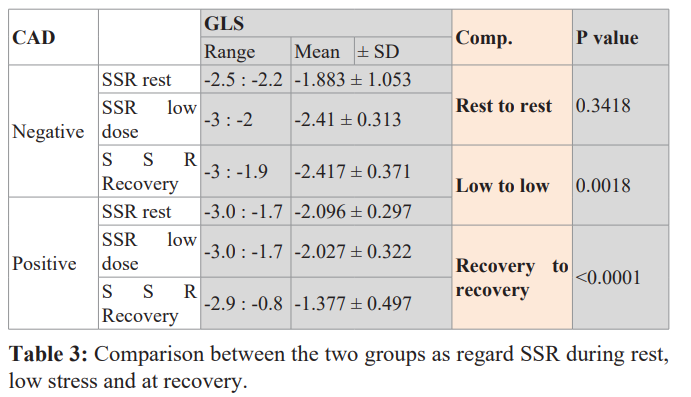
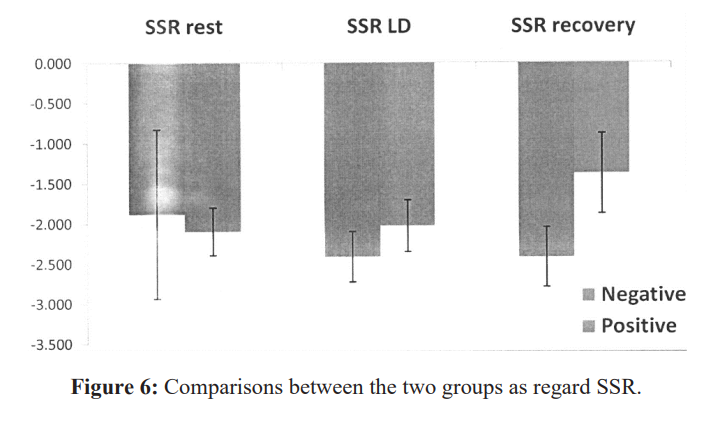
There was no statistically significant difference between the two groups as regard SSR at rest (P value =0.3418).
But there was statistically significant difference between the two groups as regard SSR at low dose and at recovery (P value = 0.0018 and <0.0001) respectively (Table 3 &figure 6).
The optimal cutoff value for GLS at recover was -19 with sensitivity for detection of significant CAD in our studied group equals to 91.7 % and with specificity equals to 88.1 % (Figure 7).
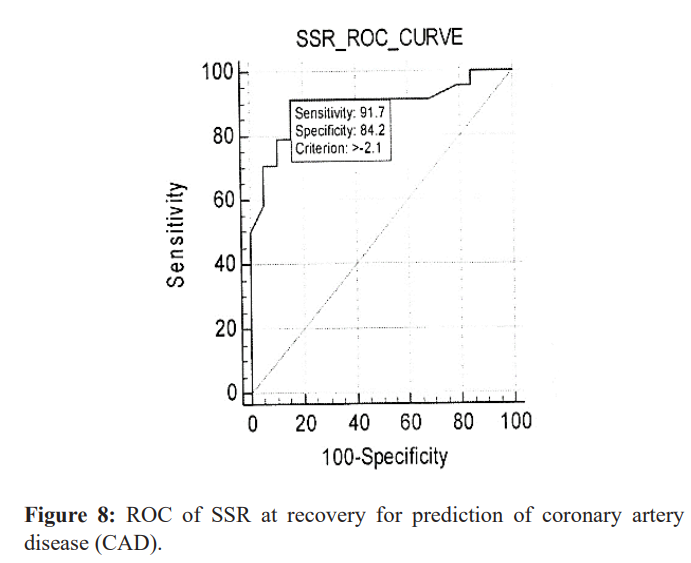
The optimal cutoff value for SSR at recovery was -2.1 with sensitivity for detection of significant CAD in our studied group equals to 91.7 % and with specificity equals to 84.2 %. (Figure 8).
In this study we found There was statistically significant deference in global longitudinal strain during recovery between single vessel (-17.32 ± 1.89), two vessel (16.5±2.24) and multi-vessel (14.8 ± 2.04), P value =0.023.

In group (2) there was no statistically significant difference between patients with significant versus non-significant coronary artery lesion as regard territorial longitudinal and circumferential strains irrespective of its artery affected as shown in table 2.
So territorial strain analysis couldn't predict the culprit lesion in our studied population.
Discussion
In this study we found that no statistically significant difference between the two groups as regard age, gender, hypertension, or smoking.
This is in agreement with those obtained by Hwang H, et al. 2014 who performed a similar study on 41 patients with known or suspected CAD and found that patient's age, sex, HTN, Smoking status and dyslipidemia had no significant difference between both groups [12].
But we found statistically significant differences between the two group as regard diabetes mellitus with P value = 0.0041.
And this was in agreement with Schreoder et al. 2013 who studied 268 patients with clinical suspicion of ACS and they found 110 (41 %) patients with significant CAD by coronary angiography which had more prevalence of diabetes mellitus than negative group [13].
As regard conventional echocardiography
In our study we found that there was no statistically significant difference between the two groups as regard LVEDD, LVESD& EF, P values were 0.157, 0.886 and 0.198 respectively. This was in agreement with Hwang H, et al. 2014 who studied 41 patients with known or suspected CAD and found that the conventional echocardiographic findings were not different between the two groups [12].
Regarding myocardial deformation
In our study we found that there was no statistically significant difference between the two groups as regards GLS at rest and low dose dobutamine.
The mean and standard deviation of GLS at rest in group 1 was -22.97 ± 2.03 versus 20.44 ± 2.40 in group 2 and P value was (P value = 0.0481), the mean and standard deviation of GLS at low dose in group 1 was -23.64 ± 1.9 versus 23.68 ± 2.23 in group 2 and P value was (P value = 0.962).
Our Study results were concordant with those obtained by Hwang H, et al. 2014 who studied 41 patients with known or suspected CAD and found that both groups were not significantly different in the values of GLS at rest and at low stress [12].
This also were concordant with RumbinaitÄ? E et al. 2015 who studied 81patients with suspected CAD and found that there were no differences in longitudinal strain parameters at rest between the two groups [13].
These data were discordant with those obtained by Ashraf Anwar. 2015 who enrolled 25 patients (mean age 51.0 ± 8.7, 64% are male) referred to coronary angiography with clinical suspicion of CAD and demonstrated that analysis of resting global and segmental LS using STE was matched with coronary angiography and more accurate than visual assessment of WMA for the detection of myocardial ischemia at rest [4].
This discrepancy between results may be due to different type of patients in his study as he studied patients with high risk profile (angina class III with multiple cardiovascular risk factors in 10 patients, positive stress electrocardiogram (ECG) in 5 patients, typical chest pain with resting ECG changes in 4 patients, atypical chest pain with impaired LV systolic function by conventional 2DE in 4 patients and typical chest pain after surgical revascularization in 2 patients) while our study include patients with low, intermediate and less number of high pretest probability.
In our study we found that there was statistically significant difference between the two groups as regard GLS at recovery.
The mean and standard deviation of GLS at recovery of group 1 was -20.40 ± 2 versus14.69 ± 2.17 in group 2 and P value was highly significant (P value < 0.0001).
This was in agreement with Hwang H, et al. 2014 who studied 41 patients with known or suspected CAD and found that the patients with CAD significantly had lower value of GLS at recovery than patients without CAD [12].
As regarding segmental longitudinal strain for detection, the extent and severity of CAD
In our study we had 2 (48%) patients with single vessel disease, 10 (40%) patients with two vessels disease and 3 (12%) patients with three vessels disease.
This was in agreement with Hwang H, et al. 2014 who studied 41 patients with known or suspected CAD and found Eleven patients (61 %) had single vessel disease, five (28%) had two vessel disease and two (11%) had three vessel disease [12].
And this was in agreement with Schreoder J, et al. 2013 who studied 268 patients with clinical suspicion of ACS and they found 110 (41 %) patients with significant CAD and they found 50 (45%) patients with single vessel disease, 32 (30%) patients with two vessel disease and 28 (25%) patients with three vessel diseases [13].
In our study we found statistically significant deference between patients with single vessel disease Vs two vessel disease and multi vessel disease as regard GLS (P=0.004).
This was in agreement with Choi J, et al. 2009 who studied 108 patients with stable CAD and found that resting GLS is significantly reduced in patients with severe CAD including LM or three vessel CAD, even when resting wall motion and LV ejection fraction are normal [15].
Territorial localization in CAD positive group
In our study we found that there was no statistically significant difference in the segmental (territorial) longitudinal strains in group 2 between patients with and without LAD, LCX or RCA lesions which signifies that we couldn't predict or identify the culprit artery by 2D STE in patients included in our study, This finding may be related to the relatively small number of the patients included, the way we included various LV segments into specific arterial territories as we considered that LAD supplying 9 segments, LCX supplying 4 segments and RCA supplying 3 segments regardless the coronary dominance, coronary variability and coronary overlap, also we had 13 patients with more than single vessel disease and only 12 patients had single vessel disease so determination of culprit artery was not possible.
This is in agreement with Moaref et aI., 2015 who studied 37 patients with clinical diagnosis of ACS and the finding of coronary angiography completely matched with finding of 2D strain in 20 patients (55%) in whom both LAD and LCX or RCA affected and both territories impaired in STE (anteroseptal and inferolateral territories) and partially matched in 10 patients (27%) and not matched in 6 patients (16%), one patient was excluded due to sub-optimal echocardiographic views [11]. So, territorial longitudinal strain until now and up to our experience cannot predict the culprit lesion.
As regard systolic strain rate (SSR)
In our study we found that there was no statistically significant difference between the two groups as regard SSR at rest.
The mean and standard deviation of SSR at rest of group 1 was -1.88 ± 1.05 versus -2.096 ± 0.3 in group 2 and P value was (P value = 0.3418).
But we found that there was statistically significant difference between the two groups as regard SSR at low dose dobutamine and at recovery.
The mean and standard deviation of SSR of group 1 at low dose and at recovery was -2.41 ± 0.313 and -2.417 ± 0.371 versus -2.027 ± 0.322 and 1.377 ± 0.497 in group 2 and P values was (P=0.0018) and (P<0.001) respectively.
This was in agreement with (RumbinaitÄ? E, et al., 2015) who studied 81 patients with known or suspected CAD to determine the diagnostic value of speckle-tracking echocardiography derived myocardial deformation parameters at rest and during stress to determine hemodynamically significance coronary artery stenosis and found that in non-pathological group, systolic longitudinal SR increased significantly from BASE to MIN and from MIN to MAX in longitudinal plane. In contrast, in the pathologic group, insignificant increase in longitudinal systolic SR from MIN to MAX was observed [14].
Also Voigt et al. 2003 demonstrated the feasibility and accuracy of strain rate amplitude and timing parameters in predicting ischemia in 44 patients with known or suspected CAD during clinical DSE and found that the increase in longitudinal systolic SR in ischemic segments was blunted (from -1.6 ± 0.8 to -2.0 ± 1.1; P < 0.05) compared with non-ischemic segments (from -1.6 ± 0.6 to -3.4 ± 1.4; P < 0.01) in response to dobutamine stimulation [16].
Conclusion
From the present study we concluded that:
- The measurement of global and segmental longitudinal strain and strain rate using STE is sensitive and accurate tool in the identification of CAD, at recovery after dobutamine echo, and nearly equal to expert wall motion analysis.
- The values of GLS and SSR at recovery may be useful to an inexperienced interpreter of wall motion analysis.
- We could differentiate between patients with single, two versus three vessels disease by 20 speckle tracking Echocardiography (longitudinal strain).
- We couldn't localize the artery involved in patients with CAD by Regional longitudinal and strain analysis.
- The global longitudinal strain and strain rate in combination with DSE is highly sensitive for detection of CAD so it can be used as screening test to identify and risk-stratify atherosclerotic
Recommendation
Left ventricular strain and strain rate analyses during DSE can be used in the assessment of significance of coronary artery stenosis in patients with suspicion of CAD to increase the accuracy of diagnosis and avoid unnecessary coronary intervention.
Further studies with larger number of patients are required.
We will focus on further myocardial strain (circumferential and radial) research.
Limitation
The accuracy of STE largely depends on image quality; however, many patients were excluded from our study because of inadequate image quality. Also, circumferential and radial strain was not performed in the present study, however, the myocardial fibers most susceptible to ischemia are the longitudinally orientated fibers that are located subendocardially, that are why measurements of longitudinal deformation are thought to be the most sensitive markers of CAD.
The assessment of coronary angiography was done qualitatively by a single cardiologist who was blinded to the results of strain analysis.
The analysis of coronary angiography included only the presence or absence of significant coronary stenosis. Territorial strain is based on a schematic distribution of territories and thus ignores the individual variation in coronary topography and dominance.
At last, this study is limited by the relatively small sample size.
References
- Habibollah Saadat, Hossein Shiri, Zahra Salarpour, et al. Exploitation of resources and cardiovascular outcomes in low-risk patients with chest pain hospitalized in coronary care units. Int J Gen Med. 2011; 4: 695-698.
- Catherine Szymanski, Luc Pierard, Patrizio Lancellotti. Imaging techniques in coronary atherosclerotic disease: dobutamine stress echocardiography-evidence and per- spectives. J Cardiovasc Med (Hagerstown). 20II; 12: 543-553.
- Hoffmann R, Lethen H, Marwick T, et al. Analysis of interinstitutional observer agreement in interpretation of dobutamine stress J Am ColICardiol. 1996; 27: 330-336.
- Anwar Accuracy of Two-Dimensional Speckle Tracking Echocardiography for the Detection of Significant Coronary Stenosis. J Cardiovasc Ultrasound. 2013; 21: 177-182.
- Kloner RA, Bolli R, Marban E, et al. Medical and cellular implications of stunning, hibernation, and preconditioning: an NHLBI workshop. Circulation. 1998; 97: 1848-1867.
- Tsoukas A, Ikonomidis I, Cokkinos P, Nihoyannopoulos P. Significance of persistent left ventricular dysfunction during recovery after dobutamine stress echocardiography. J Am CollCardiol. 1997; 30: 621-626.
- Fesmire FM, Percy RF, Bardoner IB, et al. Usefulness of automated serial 12-lead ECG monitoring during the initial emergency department evaluation of patients with chest Ann Emerg Med. 1998; 31: 3-11.
- Lang RM, Badano LP, Mor-Avi V, et Recommendations for cardiac chamber quantification by echocardiography in adults: an update from the American society of echocardiography and the European association of cardiovascular imaging. J Am Soc Echocardiogr. 2015; l6: 233-271.
- Elhendy A, Schinkel AF, Van Domburg RT, et oldermans, D.: Comparison of late outcome in patients with versus without angina pectoris having reversible perfuion abnormalities during dobutamine stress technetium-99m sestamibi single- photon emission computed tomography. The American Journal of Cardiology. 2003; 91: 264-268.
- Keddeas VW, Swelim SM, Selim GM. Role of2D speckle tracking echocardiography in predicting acute coronary occlusion in patients with non ST-segment elevation myocardial infarction. Egypt Heart J. 2017; 69: 103-110.
- Moaref A, Zamirian M, Safari A, et al. Evaluation of global and regional strain in patients with acute coronary syndrome without previous myocardial lnt Cardiovasc Res J. 2016; 10: 6-11.
- Hui-Jeong, Hwang, Hyae-Min Lee, MD, In-Ho Yang, MD, Jung Lok Lee, MD,Hyun Young Pak: The Value of Assessing Myocardial Deformation at Recovery after Dobutamine Stress Echocardiography. J Cardiovasc Ultrasound. 2014; 22: 127- 133.
- Schroeder J, Hamada S, Gru"ndlinger N, et al .,Myocardial deformation by strain echocardiography identities patients with acute coronary syndrome and non-diagnostic ECG presenting in a chest pain unit: a prospective study of diagnostic accuracy. Clin Res cardiol. 2016; 105: 248-256.
- Egle Rumbinaite , Diana Zaliaduonyte-Peksiene , Mindaugas Viezelis, et al. Dobutamine-stressechocardiography speckle- tracking imaging in the assessment of hemodynarn ic significance of coronary artery stenosis in patients with moderate and high probability of coronary artery disease. Medicina (Kaunas). 2016; 52: 331-339.
- Choi JO, Cho SW, Song YB, et Longitudinal 20 strain at rest predicts the presence of left main and three vessel coronary artery disease in patients without regional wall motion abnormality. Eur J Echocardiogr. 2009; 10: 695-701.
- Jens-Uwe Voigt, Bert Exner, Kristin Schmiedehausen, et al. Strain-rate imaging during dobutamine stress echocardiography provides objective evidence of inducible ischemia. Circulation. 2003; 107: 2120-2126.